Simulating a timer interrupt
This tutorial demonstrates the method for simulating a simple timer interrupt and how you can monitor it while it is being serviced. However, the procedure can also be used for other types of interrupts.
The tutorial also shows how to use compiler keywords and pragma directives for writing your interrupt service routines directly in C.
Note that the screenshots in this tutorial do not always correspond exactly to the counterparts in your product.
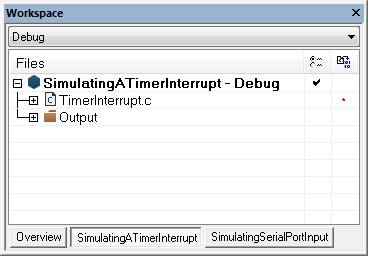
This tutorial assumes that you are familiar with basic use of IAR Embedded Workbench, see the tutorials Getting Started using IAR Embedded Workbench.
Tutorial overview
Tutorial description
The IAR C-SPY® Simulator can on a basic level simulate the interrupt mechanism available on your device. In C-SPY, you can specify timing information and other characteristics required for realistic generation of interrupt activation signals. The tutorial demonstrates how you can use these mechanisms to generate interrupts and to verify that your interrupt setup code is correct and that your interrupt service routines work as intended.
Files used in this tutorial
The project in this tutorial uses these files:
*
Contains an interrupt service routine for a timer which increments a counter. The main function sets the necessary status registers. The application exits when 100 interrupts have been generated.
*
Contains the definition of the interrupt vector that is used in this tutorial.
Opening the tutorial workspace
1
2
Click the Product explorer symbol.
3
Under the heading Advanced Debugging, click Open tutorial workspace. Choose a destination for your project in the browse dialog box that appears. We recommend that you create a specific directory (with a subdirectory) where you store all your tutorial files, if not already done. In this tutorial we call the directory MyTutorials and the subdirectory AdvancedDebugging. The AdvancedDebugging workspace is opened in the IDE.
4
In the Workspace window, select the SimulatingATimerInterrupt project, right-click and choose Set as Active.
Simulating a timer interrupt
In this example procedure, you will work through these steps:
*
*
*
*
Adding your interrupt service routine
1
Open the file TimerInterrupt.c, which here is demonstrated by a few snippets which show how you can use some keywords and pragma directives for writing an interrupt service routine in C:
#pragma language = extended
 
#include <stdio.h>
#include <stdint.h>
#include <intrinsics.h>
 
static volatile uint_fast8_t counter = 0;
void main (void)
{
/* Timer setup code */
....
_ _enable_interrupt(); /* Enable interrupts */
while (counter < 100); /* Wait loop */
puts("Done\n");
}
 
/* Timer interrupt service routine. */
void basic_timer(void)
{
counter += 1;
}
The interrupt vector is defined in cstartupCM3.s which is included in the project.
2
Use the TimerInterrupt.c file as is; you do not have to modify it in any way for this tutorial.
Setting up the project
The SimulatingATimerInterrupt project is preconfigured with appropriate option settings for this tutorial. Still, this procedure guides you through the option settings required for this tutorial.
1
Choose Project>Options>General Options>Target and select a device. You can find information about which device to use for this tutorial in the header of TimerInterrupt.c.
A suitable device description file will automatically be used later on when you start the C-SPY debugger. This file contains device-specific information required by the C-SPY debugger to simulate, for example the interrupt used in this tutorial.
2
Choose Project>Options>Debugger>Setup and choose Simulator from the Driver drop-down list.
3
Setting up the interrupt simulation
The C-SPY interrupt system is based on the cycle counter. You can specify the amount of cycles to pass before C-SPY generates an interrupt. This example procedure demonstrates how you set up an interrupt interactively by using a dedicated dialog box and how you make interrupts to be generated every 2000 cycles.
1
Choose Simulator>Interrupt Configuration to open the Interrupt Configuration window.
2
Right-click in the window and select Enable interrupt simulation to enable interrupt simulation.
3
 
The interrupt definition (retrieved from the ddf file) that the simulator uses to simulate the interrupt correctly.
During execution, after each completed simulation of a single assembler instruction, the C-SPY simulator will check whether the activation time has been reached. If so, the interrupt will be triggered and set to pending provided that Probability is set to 100% (which it is in this example).
If the interrupt is acknowledged within the hold time, the interrupt service routine is serviced. Otherwise, the interrupt will expire. In both cases, a new interrupt will be triggered after the repeat interval.
Monitoring the interrupts during execution
1
Choose View>Terminal I/O to open the Terminal I/O window.
2
*
*
When the counter variable reaches 100, the string Done is printed in the Terminal I/O window.
3
*
Choose Simulator>Interrupt Log to open the Interrupt Log window, which logs various information about the interrupts, such as entrances to and exits from interrupt service routines, and whether the interrupt is triggered or has expired (reached the hold time).
From the context menu available in the Interrupt Log window, choose Enable to enable the logging.
*
Choose Simulator>Timeline to open the Timeline window which provides a graphical view of the interrupt events during the execution of your application.
Right-click in the window and choose Select Graphs>Interrupts.
Click in the Interrupts graph, right-click and choose Enable from the context menu to enable the Interrupt Log graph.
*
Choose Simulator>Interrupt Status to open the Interrupt Status window which shows the status of all the currently active interrupts, in other words, interrupts that are either being serviced or waiting to be serviced.
*
Choose Simulator>Available Interrupts to open the Available Interrupts window where you can force an interrupt instantly. Typically, this is useful when you are setting up an interrupt and you want to determine whether the interrupt is setup correct, and whether the interrupt service routine is invoked as expected.
Note that if the menu commands are not available, these windows are not supported by the product you are using.
4
5
Click the Reset button (
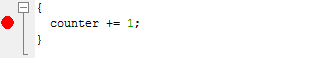
) and then click the Go button() to restart execution. Execution stops at the breakpoint. You can now view the information about the interrupt in the various windows:
*
In the Interrupt Log window you can see at which time and at which program counter value the interrupt was triggered.
*
In the Timeline window you can see that the Interrupt Log graph (illustrated with a black line) has appeared. The execution start of the interrupt service routine is illustrated with a black vertical line.
Use the + and - keys to zoom in or out.
Use the arrow keys, Home, End, or Ctrl+End to move backwards and forward between the various interrupts in the graph.
*
In the Interrupt Status window you can see that the interrupt is currently being serviced.
6
Click Go again.
In the Interrupt Log window you can now see that a new interrupt has been generated. Double-click the Leave cell for the first interrupt; focus switches to the editor window and in the Interrupt Log graph in the Timeline window where the first interrupt is now illustrated by a green box.
Point at the green box with the mouse pointer to get detailed tooltip information for that interrupt.
7
Remove the breakpoint and then click Go again. The application reaches its end.
As you can see in the graph, several interrupts have now been generated.