Basic debugging
This tutorial explores the basic facilities of the C-SPY® debugger while debugging the application used in the previous tutorial Creating an application project. The tutorial assumes that you are using the C-SPY simulator.
Note that the screenshots in this tutorial do not always correspond exactly to the counterparts in your product.
Tutorial overview
Files used in this tutorial
The project in this tutorial uses these files:
*
Contains a simple application that uses only standard features of the C language. It initializes an array with the ten first Fibonacci numbers and prints the result to stdout.
*
Contains required definitions and declarations.
*
Contains utility routines required by Fibonacci.c for the Fibonacci calculations.
*
Contains required definitions and declarations.
Opening the tutorial project
1
2
Click the Product explorer button.
3
Under the heading Getting started using IAR Embedded Workbench, click Open tutorial workspace. Choose a destination for your project in the browse dialog box that appears. We recommend that you create a specific directory (with a subdirectory) where you store all your tutorial files, if not already done. In this tutorial we call the directory MyTutorials and the subdirectory GettingStarted.
After you have chosen a destination directory, the GettingStarted workspace which contains the BasicDebugging project, is opened in the IDE.
Debugging the application
In this example procedure, you will work through these steps:
*
*
*
*
*
*
*
*
For more information about debugging, see the C-SPY® Debugging Guide.
Starting the C-SPY debugger
1
Choose Project>Options and then the Debugger category. On the Setup page, make sure that you have chosen Simulator from the Driver drop-down list and that Run to main is selected. Click OK.
2
Choose Project>Download and Debug. Alternatively, click 
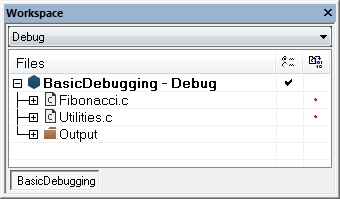
the Download and Debug button in the toolbar. C-SPY starts with the BasicDebugging project loaded. In addition to the windows already opened in the IDE, a set of C-SPY-specific windows are now available.
3
In the IDE, you can dock windows at specific places, and organize them in tab groups. You can also make a window floating, which means it is always on top of other windows. If you change the size or position of a floating window, other currently open windows are not affected.
Note:  
Depending on the toolchain you are using, the current position—indicated by a green arrow—might now be main or callCount.
Stepping and inspecting source code
Before inspecting the source statements, make sure the Fibonacci.c file is open.
1
With Fibonacci.c displayed in the editor window, use the Debug>Step Over command until you reach the call to the InitFib function.
Alternatively, click the Step Over button on the toolbar.
2
Choose Debug>Step Into to step into the function InitFib.
Alternatively, click the Step Into button on the toolbar.
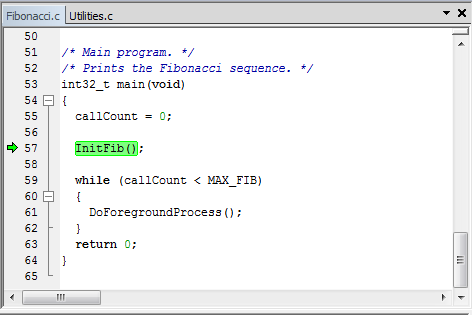
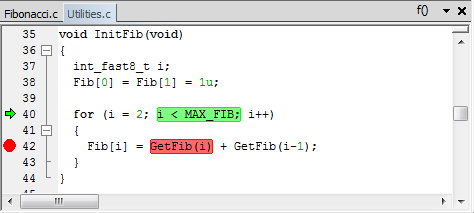
At source level, the Step Over and Step Into commands allow you to execute your application one statement at a time. Step Into continues stepping inside function or subroutine calls, whereas Step Over executes each function call in a single step. For more information, see the C-SPY® Debugging Guide.
When Step Into is executed you will notice that the active window changes to Utilities.c because the function InitFib is located in this file.
3
Use the Step Over command until you reach the for loop.
4
Use Step Over until you are back at the top of the for loop. Notice that the step points are on a function call level, not on a statement level.
You can also step on a statement level. Choose Debug>Next statement to execute one statement at a time. Alternatively, click the Next statement button on the toolbar.
Notice how this command differs from the Step Over and the Step Into commands.
5
Choose View>Disassembly to open the Disassembly window, if it is not already open.You will see the assembler code corresponding to the current C statement.
Click in the Disassembly window to make it active and try the step commands also in the Disassembly window.
Inspecting variables
C-SPY allows you to watch variables or expressions in the source code, so that you can keep track of their values as you execute your application. You can look at a variable in several ways. For example:
*
*
Open one of the Auto, Locals, Live Watch, Statics, or Watch windows.
In this example procedure, you will look into some of these methods. For more information about inspecting variables, see the C-SPY® Debugging Guide.
Note:  
When the optimization level None is used, all non-static variables will live during their entire scope and thus the variables are fully debuggable. When higher levels of optimizations are used, variables might not be fully debuggable.
To use the Auto window:
1
Choose View>Auto to open the Auto window.
The Auto window will show the current value of recently modified expressions (in red).
2
To set a watchpoint :
1
Choose View>Watch>Watch 1 to open a Watch window.
2
Set a watchpoint on the variable i using this procedure:
*
Click <click to add> in the Watch window.
*
In the entry field that appears, type i and press the Enter key.
3
You can also drag a variable from the editor window to the Watch window. Select the Fib array in the InitFib function, then drag it to the Watch window.
The Watch window will show the current value of i and Fib. You can expand the Fib array to watch it in more detail.
4
Execute some more steps to see how the values of i and Fib change. To change a value manually, select it and type a new value.
5
To remove a variable from the Watch window, select it and press Delete.
Setting and monitoring breakpoints
C-SPY contains a powerful breakpoint system with many features, allowing you to stop at locations of particular interest.
To set a breakpoint:
1
Set a breakpoint on the function call GetFib(i) using this procedure:
*
In the Utilities.c file, click on the statement to position the insertion point.
*
Right-click and choose Toggle Breakpoint (Code) from the context menu.
A breakpoint will be set at this function call. The function call will be highlighted and there will be a red dot in the margin to show that there is a breakpoint there.
These are additional ways to set breakpoints:
*
*
*
*
Use the breakpoints dialog box. Choose View>Breakpoints to open the Breakpoints window. In this window, right-click and choose New Breakpoint from the context menu. In the dialog box that appears, specify the breakpoint characteristics.
2
To view the defined breakpoints, choose View>Breakpoints to open the Breakpoints window. You can find information about the breakpoint execution in the Debug Log window.
To execute up to a breakpoint:
1
Alternatively, click the Go button on the toolbar.
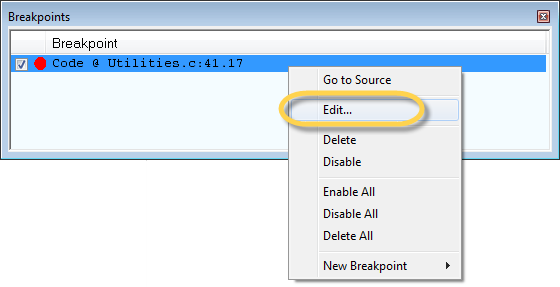
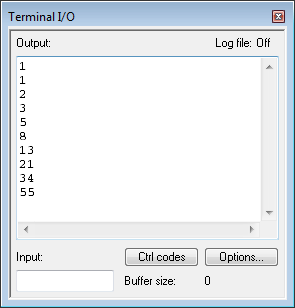
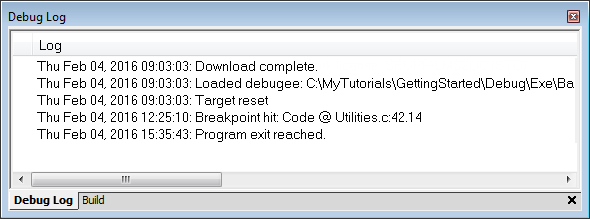
The application will execute up to the breakpoint you have set. The Watch window displays the value of the Fib expression and the Debug Log window contains information about the breakpoint.
End by resetting the application: Choose Debug>Reset, or click the Reset button on the toolbar.
To add a condition to the breakpoint:
1
Choose View>Breakpoints to open the Breakpoints window (if not already open).
2
The Edit Breakpoint dialog box appears.
3
In the Expression text box, specify your condition, for example: i == 5.
Click OK.
4
Click the Go button (
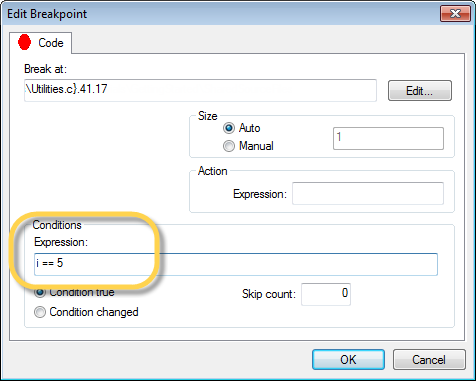
). In the Watch window you can see that the execution has stopped according to the condition you specified; thus, the value of i is now 5.
5
Select the breakpoint, right-click and choose Toggle Breakpoint (Code) from the context menu, alternatively choose Toggle Breakpoint from the Edit menu to remove the breakpoint.
For more information about breakpoints, see the C-SPY® Debugging Guide.
Monitoring registers
The Registers window lets you monitor and modify the contents of the processor registers.
1
Choose View>Registers>Registers 1 to open a Registers window.
About the Registers window:
*
*
*
2
Click Step Over () to execute the next instructions, and watch how the values change in the Registers window.
3
Close the Registers window.
Monitoring memory
The Memory window lets you monitor selected areas of memory. In this example procedure, the memory corresponding to the array Fib will be monitored.
1
Choose View>Memory>Memory 1 to open a Memory window.
2
Make the Utilities.c window active and select Fib. Then drag it from the editor window to the Memory window.
The memory contents in the Memory window corresponding to the array Fib is displayed.
3
If not all memory units have been initialized by the InitFib function of the C application yet, continue to step over and you will notice how the memory contents are updated.
To change the memory contents, edit the values in the Memory window. Just place the insertion point at the memory content that you want to edit and type the desired value.
Close the Memory window.
Viewing terminal I/O
Sometimes you must debug applications that use stdin and stdout without having hardware support available. C-SPY lets you simulate stdin and stdout by using the Terminal I/O window.
1
Choose View>Terminal I/O to display the output from the I/O operations.
2
The contents of the window depends on how far you have executed the application.
Reaching application exit
1
Alternatively, click the Go button on the toolbar.
As no more breakpoints are encountered, C-SPY reaches the end of the application and a Program exit reached message is printed in the Debug Log window.
All output from the application has now been displayed in the Terminal I/O window.
If you want to start again with the existing application, choose Debug>Reset, or click the Reset button on the toolbar.
2
To exit from C-SPY, choose Debug>Stop Debugging. Alternatively, click the Stop Debugging button on the toolbar. The IAR Embedded Workbench IDE main window is displayed.
C-SPY also provides many other debugging facilities. Some of these are described in the advanced debugging tutorials.
For more information about how to use C-SPY, see the C-SPY® Debugging Guide.